Consider the following graph.The data for the graph was obtained at constant temperature. 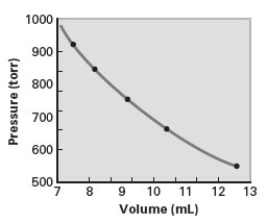 Which of the following correctly describes the relationship shown on the graph?
i.V ∝ P
ii.V ∝ 1/P
iii.V = kP
iv.V = k(1/P)
A) iv only
B) i and ii
C) iii and iv
D) i and iii
E) ii and iv
Correct Answer:
Verified
Q18: Which of the following is incorrect?
A)1.35 atm
Q19: Which of the following statements is true?
A)Gas
Q20: Consider the following image showing a sample
Q21: Which of the following correctly describes the
Q22: Which of the following correctly expresses Charles's
Q24: 27.7 L of a gas is cooled
Q25: The temperature of a gas is 23°C.What
Q26: Which of the following correctly expresses Boyle's
Q27: A fixed quantity of a gas is
Q28: A 0.732 m3 sample of a gas
Unlock this Answer For Free Now!
View this answer and more for free by performing one of the following actions

Scan the QR code to install the App and get 2 free unlocks

Unlock quizzes for free by uploading documents