Consider the following graph. 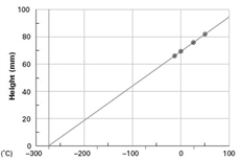 This graph is an illustration of which of the following laws?
A) Charles's law
B) Boyle's law
C) combined gas law
D) law of conservation of mass
E) law of conservation of energy
Correct Answer:
Verified
Q24: 27.7 L of a gas is cooled
Q25: The temperature of a gas is 23°C.What
Q26: Which of the following correctly expresses Boyle's
Q27: A fixed quantity of a gas is
Q28: A 0.732 m3 sample of a gas
Q30: A container holds 34.3 m3 of gas
Q31: A gas has a volume of 3.77
Q32: A cylindrical gas chamber has a piston
Q33: The pressure on 474 mL of a
Q34: A gas sample was originally in a
Unlock this Answer For Free Now!
View this answer and more for free by performing one of the following actions

Scan the QR code to install the App and get 2 free unlocks

Unlock quizzes for free by uploading documents