Following is a table of data collected from one section of an 8 a.m.physiology lab.There were 20 students present,10 men and 10 women.Information collected from the students included their height,weight,age,and resting pulse rate.In addition,the students were surveyed to see if they smoked cigarettes,considered themselves "regular exercisers," if they had consumed caffeine the morning of the lab,and if they had eaten breakfast that day.A "y" or "n" (yes or no)was recorded to indicate their answers.Each student did "jumping jacks" for 5 minutes and recorded the time required to regain their resting heart rate,which is listed on the table as "recovery time." Finally,each student participated in an exercise designed to measure their reaction time (in milliseconds)in catching an object dropped by a lab partner according to specified criteria.Use this table to answer the following questions.Ignore statistical problems caused by small sample size,and so on. 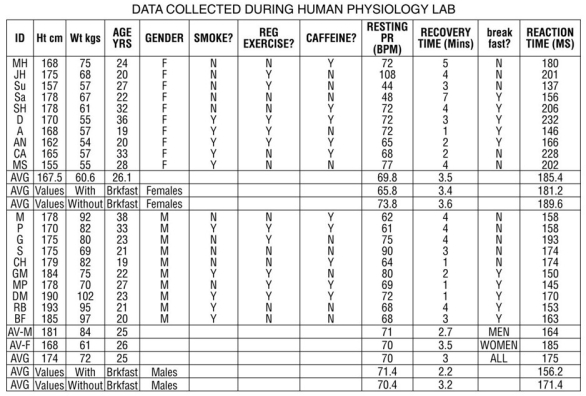 Table 1.3
 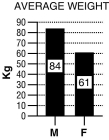 For these questions,the data were separated and analyzed by gender.
-Refer to Table 1.3 and the bar graph.
A.Write a hypothesis regarding gender and weight.
B.What is the dependent variable? What is the independent variable?
C.Based on the data in the graph above,what is your conclusion?
D.Why is a bar graph a good choice for presentation of these data? Would another type of chart be as effective?
Correct Answer:
Verified
B.Weigh...
View Answer
Unlock this answer now
Get Access to more Verified Answers free of charge
Q44: You are designing a study to assess
Q46: Table 1.1 Q49: Explain why the prefix homeo- is used Q52: Provide an example of a control system.Be Q54: In your study of a drug's efficacy Q56: High cholesterol levels have been known to
![]()
Unlock this Answer For Free Now!
View this answer and more for free by performing one of the following actions

Scan the QR code to install the App and get 2 free unlocks

Unlock quizzes for free by uploading documents