Multiple Choice
Figure 19.1 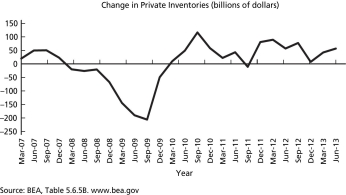
-Figure 19.1 displays changes in the size of private inventories.Based on the figure,in which month is the size of private inventories likely to have been lowest?
A) September 2010
B) September 2011
C) September 2009
D) March 2010
Correct Answer:
Verified
Related Questions
Q42: Desired Level of the Capital Stock
Q43: When Tobin's q is greater than one,_.
A)a
Q44: Fluctuations in Tobin's q are _,because _.
A)frequent
Q45: Desired Level of the Capital Stock
Unlock this Answer For Free Now!
View this answer and more for free by performing one of the following actions

Scan the QR code to install the App and get 2 free unlocks

Unlock quizzes for free by uploading documents