Figure 19.1 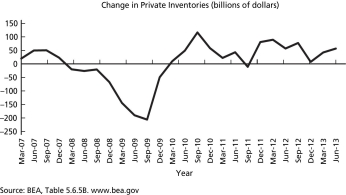
-Which of the following is the most likely explanation for the behavior of private inventories between September 2007 and September 2009,as depicted in Figure 19.1?
A) a substantial decline in the desired level of inventories,due to a slump in aggregate demand
B) a substantial decline in the desired level of inventories,as improvements in technology have reduced the size of inventories needed to support both production and customer deliveries
C) an unanticipated draw-down of inventories as the economy was growing much faster than expected
D) a substantial decline in the desired level of inventories,as changes in the tax code increased the cost of holding inventories
Correct Answer:
Verified
Q49: Tobin's q theory adds to neoclassical theory
Q50: Desired Level of the Capital Stock
Q51: Desired Level of the Capital Stock
Q52: Tobin's q is equal to _.
A)the market
Q53: A decline in Tobin's q can be
Q55: Desired Level of the Capital Stock
Q56: If the market value of a firm
Q57: According to Tobin's q theory,the principal objective
Q58: A rise in stock prices leads to
Q59: Which ratio correctly highlights the similarity between
Unlock this Answer For Free Now!
View this answer and more for free by performing one of the following actions

Scan the QR code to install the App and get 2 free unlocks

Unlock quizzes for free by uploading documents