The following diagram shows two budget lines: A and B. 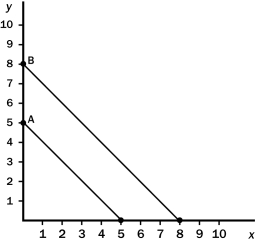
Which of the following could explain the change in the budget line from A to B?
A) a simultaneous decrease in the price of X and the price of Y
B) an increase in income
C) an increase in income and a decrease in the price of Y
D) Both a and b are correct.
Correct Answer:
Verified
Q87: The following diagram shows a budget constraint
Q89: The following diagram shows two budget lines:
Q92: Figure 21-4 Q93: Figure 21-4 Q94: The following diagram shows a budget constraint Q131: Suppose a consumer is currently spending all Q135: A consumer is currently spending all of Q386: Figure 21-2 The downward-sloping line on the Q468: Suppose a consumer spends her income on Q471: The slope of the budget constraint is![]()
![]()
Unlock this Answer For Free Now!
View this answer and more for free by performing one of the following actions

Scan the QR code to install the App and get 2 free unlocks

Unlock quizzes for free by uploading documents