Multiple Choice
Figure 5-12
The following figure shows the supply curve for a particular good. 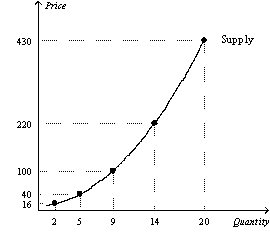
-Refer to Figure 5-12.Using the midpoint method,what is the price elasticity of supply between $100 and $220?
A) 0.58
B) 0.67
C) 1.00
D) 1.73
Correct Answer:
Verified
Related Questions

