Figure 5-12
The following figure shows the supply curve for a particular good. 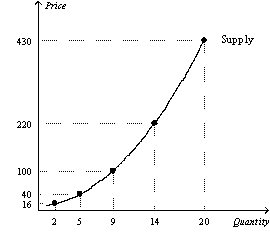
-Refer to Figure 5-12.Over which range is the supply curve in this figure the most elastic?
A) Between $16 and $40
B) Between $40 and $100
C) Between $100 and $220
D) Between $220 and $430
Correct Answer:
Verified
Q15: As price elasticity of supply increases,the supply
Q18: Some firms eventually experience problems with their
Q322: If a 30 percent change in price
Q323: If two supply curves pass through the
Q324: Figure 5-12
The following figure shows the supply
Q326: Suppose the price elasticity of supply for
Q328: If the price elasticity of supply is
Q331: If a 25% change in price results
Q332: When a supply curve is relatively flat,
A)
Q338: Scenario 5-1
Suppose that the supply of aged
Unlock this Answer For Free Now!
View this answer and more for free by performing one of the following actions

Scan the QR code to install the App and get 2 free unlocks

Unlock quizzes for free by uploading documents