Figure 5-7
The following graph shows the linear demand curve for a particular good. 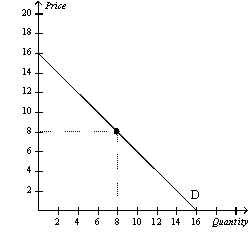
-Refer to Figure 5-7.For prices below $6,demand is price
A) elastic,and total revenue will rise as price rises.
B) inelastic,and total revenue will rise as price rises.
C) elastic,and total revenue will fall as price rises.
D) inelastic,and total revenue will fall as price rises.
Correct Answer:
Verified
Q157: If a change in the price of
Q158: When demand is elastic,an increase in price
Q166: Which of the following could be the
Q169: If the price elasticity of demand for
Q176: Which of the following could be the
Q224: Figure 5-10 Q225: Figure 5-8 Q226: If demand is price inelastic,then when price Q230: Figure 5-9 Q258: Figure 5-9 Unlock this Answer For Free Now! View this answer and more for free by performing one of the following actions Scan the QR code to install the App and get 2 free unlocks Unlock quizzes for free by uploading documents![]()
![]()
![]()
![]()

