A tire company is interested in monitoring the process that produced tread thickness on its tires.Every hour 4 tires are selected from production and the tread thickness is measured.Data for the past 25 days is shown as follows: 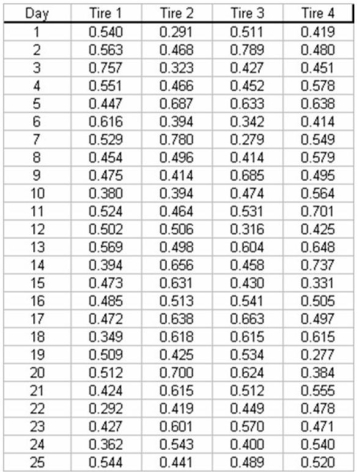 a.What type of control chart would you recommend be used in this case?
b.Compute the upper and lower control limits for these data.
Correct Answer:
Verified
View Answer
Unlock this answer now
Get Access to more Verified Answers free of charge
Q21: A p-chart is useful for:
A) analyzing whether
Q23: Because variations are unavoidable in a system,
Q27: Statistical Process Control charts are used to
Q34: A plywood manufacturer is interested in monitoring
Q37: Which of the following statements is correct?
A)
Q38: Each evening, a nationwide retail chain randomly
Q39: The statistical process control (SPC) chart is
Q40: Recently a shipping company took 30 samples,
Q41: Explain the relationship between control limits and
Q42: A major airline is interested in monitoring
Unlock this Answer For Free Now!
View this answer and more for free by performing one of the following actions

Scan the QR code to install the App and get 2 free unlocks

Unlock quizzes for free by uploading documents