Graph 22-9
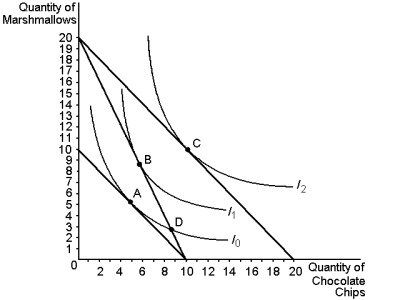
-Refer to Graph 22-9. Assume that the consumer depicted in the graph has an income of $50. Using the information above, which of the following price-quantity combinations would be on her demand curve for marshmallows if the price of chocolate chips is $5?
A) $5, 8
B) $5, 4
C) $2.50, 8
D) $2.50, 4
Correct Answer:
Verified
Q129: One reason an individual labour supply curve
Q130: Amy purchases only coffee and croissants.If coffee
Q131: Photographic negative film has to be developed
Q131: Amy is a professional photographer who specialises
Q132: When leisure is a normal good, the
Q133: The backward bending portion of an individual
Unlock this Answer For Free Now!
View this answer and more for free by performing one of the following actions

Scan the QR code to install the App and get 2 free unlocks

Unlock quizzes for free by uploading documents