Multiple Choice
Graph 7-4 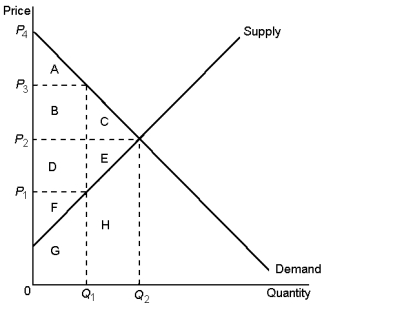
-In Graph 7-4, at the market-clearing equilibrium, total surplus is represented by the area:
A) A + B + C
B) A + B + D + F
C) A + B + C + D + E +F
D) A + B + C + D + E + F + G + H
Correct Answer:
Verified
Related Questions
Q130: Graph 7-4 Q131: We can say that the allocation of Q132: The 'invisible hand' refers to the: Q133: Graph 7-4 Q134: Graph 7-6 Q136: Table 7-3 Q137: Table 7-3 Unlock this Answer For Free Now! View this answer and more for free by performing one of the following actions Scan the QR code to install the App and get 2 free unlocks Unlock quizzes for free by uploading documents![]()
A)marketplace guiding![]()
![]()
Market supply and demand for
Market supply and demand for

