Graph 7-3
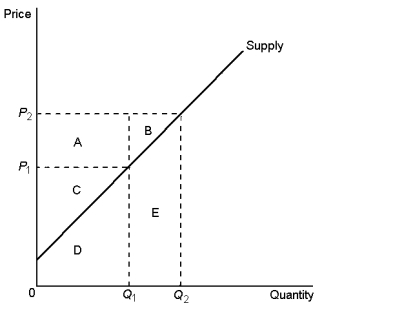
-According to Graph 7-3, area B represents:
A) producer surplus to new producers entering the market as the result of price rising from P1 to P2
B) the increase in consumer surplus that results from an upward-sloping supply curve
C) a decrease in producer surplus to each producer in the market
D) an increase in total surplus when sellers are willing and able to increase supply from Q1 to Q2
Correct Answer:
Verified
Q104: Producer surplus measures the:
A)wellbeing of sellers
B)wellbeing of
Q107: Costa and Soula sell lemonade on the
Q108: Gene earns $15,000 for shooting alligators under
Unlock this Answer For Free Now!
View this answer and more for free by performing one of the following actions

Scan the QR code to install the App and get 2 free unlocks

Unlock quizzes for free by uploading documents