Graph 7-2
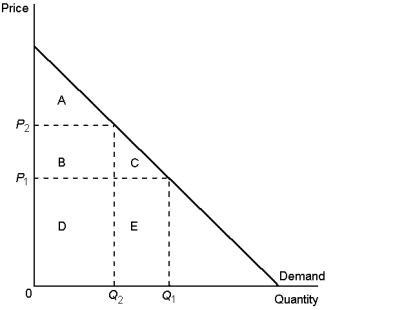
-According to Graph 7-2, area C represents:
A) the decrease in consumer surplus that results from a downward-sloping demand curve
B) consumer surplus to new consumers who enter the market when the price falls from P2 to P1
C) an increase in producer surplus when the quantity sold increases from Q2 to Q1
D) a decrease in consumer surplus to each consumer in the market
Correct Answer:
Verified
Q82: Normative analysis refers to what:
A)is
B)should be
C)maximises efficiency
D)is
Q87: Positive analysis refers to what:
A)is
B)should be
C)could be
D)is
Q88: The particular price that results in quantity
Unlock this Answer For Free Now!
View this answer and more for free by performing one of the following actions

Scan the QR code to install the App and get 2 free unlocks

Unlock quizzes for free by uploading documents