Multiple Choice
Figure 2 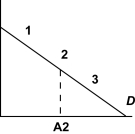
In Figure 2,the point A2 is half way between the origin and the quantity intercept of the demand curve.The price elasticity at point "2" is
A) 0
B) between - and -1
C) -1
D) between -1 and 0
Correct Answer:
Verified
Related Questions
Q6: Suppose there are two goods (X and
Q7: Demand functions are "homogeneous of degree zero
Q18: Suppose Q22: Two goods,X and Y,are called complements if Q22: An increase in quantity demanded is represented Q23: If income doubles and the quantity demanded Unlock this Answer For Free Now! View this answer and more for free by performing one of the following actions Scan the QR code to install the App and get 2 free unlocks Unlock quizzes for free by uploading documents![]()
A)

