The following charts are published by the Government of Canada in its Annual Financial Report 2008-2009. Based on the charts, answer the following questions. 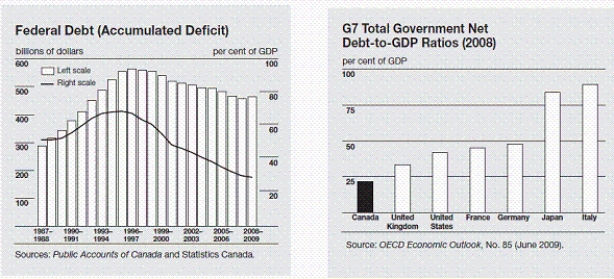
-What was the evolution of Canada's federal debt over the period 1967-2009?
Correct Answer:
Verified
View Answer
Unlock this answer now
Get Access to more Verified Answers free of charge
Q39: It is possible that the cost of
Q91: Suppose a country has had a high
Q99: Explain why policy lags could make stabilization
Q101: Consider a 25-year-old worker who saves $1000
Q102: The following charts are published by the
Q105: Let d be the percentage change
Q105: The rate of growth in the Debt
Q106: If you deposit $100 now with interest
Q108: Under the same circumstances as in (b),
Q117: Why do many economists advocate a consumption
Unlock this Answer For Free Now!
View this answer and more for free by performing one of the following actions

Scan the QR code to install the App and get 2 free unlocks

Unlock quizzes for free by uploading documents