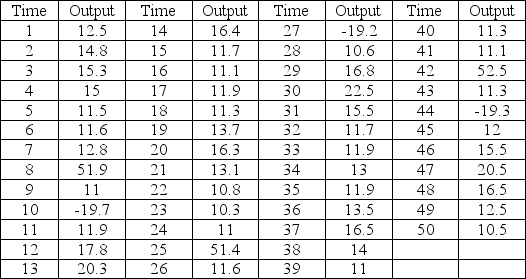
Using the data in the table,first plot the data and comment on the appearance of the demand pattern.Then develop a forecast for periods 51-70 that fits the data.
Correct Answer:
Verified
View Answer
Unlock this answer now
Get Access to more Verified Answers free of charge
Q21: Two time series techniques that are appropriate
Q40: A counseling service records the number of
Q41: A poultry farmer that dabbles in statistics
Q42: McMahon and Tate advertising company is interested
Q43: A well-educated lumberjack decides to use linear
Q45: Multiple regression was used to forecast success
Q46: Heidi runs a multiple regression for the
Q47: Which of these quantitative techniques is a
Q49: A poultry farmer that dabbles in statistics
Q79: The forecast data matches the actual data
Unlock this Answer For Free Now!
View this answer and more for free by performing one of the following actions

Scan the QR code to install the App and get 2 free unlocks

Unlock quizzes for free by uploading documents