Figure 11.13 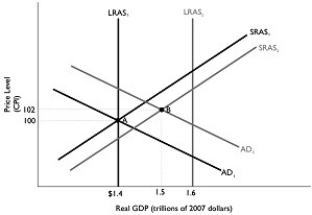 Alt text for Figure 11.13: In figure 11.13, a dynamic model of AD-AS.
Long description for Figure 11.13: The x-axis is labelled, real GDP (trillions of 2007 dollars) , with values $1.4, 1.5, 1.6 marked.The y-axis is labelled, price level (CPI) , with values 100 and 102 marked.6 lines are shown; SRAS1, SRAS2, AD1, AD2, LRAS1, LRAS2.Line SRAS1 begins in the bottom left and slopes up to the top right corner.Line SRAS2 follows the same slope as line SRAS1, but is plotted to the right.Line AD1 begins at the top left corner and slopes down to the end of the x-axis.Line AD2 follows the same slope as AD1, but is plotted to the right.Line LRAS1 is perpendicular to the x-axis, and begins from the x-axis value $1.4.Line LRAS2 is perpendicular to the x-axis, and begins from the value 1.6.Line LRAS1 intersects line AD1 and SRAS1 at point A ($1.4, 100) .Lines AD2 and SRAS2 intersect at point B (1.5, 102) .Points A and B are connected to their respective coordinates on the x-axis and y-axis with dotted lines.Line LRAS2 intersects lines SRAS1 and SRAS2 on the right end of these lines.Similarly, line LRAS2 intersects lines AD1 and AD2 toward the right end of these lines.
-Refer to Figure 11.13.In the dynamic model of AD-AS in the figure above, the economy is at point A in year 1 and is expected to go to point B in year 2, and the Bank of Canada pursues the appropriate policy.This will result in
A) unemployment rates higher than what would occur if no policy had been pursued.
B) inflation higher than what would occur if no policy had been pursued.
C) real GDP lower than what would occur if no policy had been pursued.
D) short-term interest rates higher than what would occur if no policy had been pursued.
E) long-term interest rates higher than what would occur if no policy had been pursued.
Correct Answer:
Verified
Q154: Your income will increase if the Bank
Q155: What actions should the Bank of Canada
Q156: Contractionary monetary policy refers to the Bank

