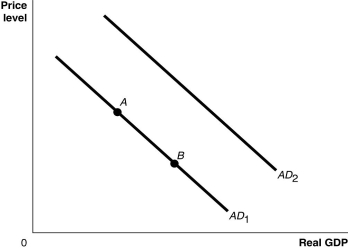
Figure 9.1  Alt text for Figure 9.1: In figure 9.1, a graph comparing real GDP and price level.
Long description for Figure 9.1: The x-axis is labelled, real GDP, and the y-axis is labelled, price level, with 0 at the vertex.Line AD1 begins in the top left corner and slopes down to the bottom center.Line AD2 follows the same slope as line AD1 but is plotted to the right.Points A and B are plotted along line AD1.Point A is a little less than half way along the left side of the line, and point B is little more than half way on the right side of the line.
-Refer to Figure 9.1.Ceteris paribus, a decrease in the growth rate of domestic GDP relative to the growth rate of foreign GDP would be represented by a movement from
A) AD1 to AD2.
B) AD2 to AD1.
C) point A to point B.
D) point B to point A.
Correct Answer:
Verified
Q26: Suppose Canadian GDP growth rate is faster
Q28: In September of 2007, the Bank of
Q29: How do lower income taxes affect aggregate
Q30: Last week, six Swedish kronor could purchase

