Figure 8.2 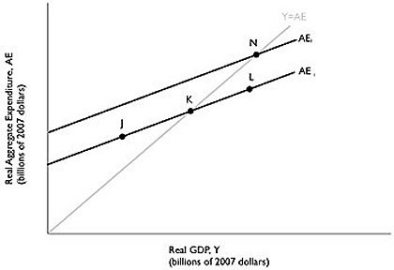 Alt text for Figure 8.2: In figure 8.2, a graph comparing real GDP and real aggregate expenditure.
Long description for Figure 8.2: Line AE1, begins a little less than half way along the x-axis and slopes up toward the end of the x-axis.Line AE2, begins at a point half way on the x-axis and slopes up to the top right corner.Line AE2 is to the left of AE1, and is on a similar path as the line AE1.Line Y = AE, originates at the vertex and slopes upward toward the top right corner.Line Y = AE meets line AE1 at point K, half way along both lines, and meets line AE2 at point N, plotted close to the right end of the line AE2.Point J is plotted a little less than half way along the line AE1, to the left of point K.Another point L is marked close to the right end of line AE1, to the right of point K.
-Refer to Figure 8.2.If the Canadian economy is currently at point N, which of the following could cause it to move to point K?
A) Households expect future income to decline.
B) Household wealth rises.
C) The firm's cash flow rises as profits rise.
D) Government expenditures increase.
E) Canadians begin importing more goods.
Correct Answer:
Verified
Q157: The marginal propensity to consume measures the
Q180: Which of the following will increase aggregate
Q182: How does a decrease in government spending
Q183: Following recession, slow economic growth, and increasing
Q187: Assume that inventories declined by more than
Q188: On the 45-degree line diagram, the 45-degree
Q189: If planned aggregate expenditure is below potential
Q207: Use a 45-degree diagram to illustrate macroeconomic
Q211: What is the difference between aggregate expenditure
Q213: For all points below the 45 degree
Unlock this Answer For Free Now!
View this answer and more for free by performing one of the following actions

Scan the QR code to install the App and get 2 free unlocks

Unlock quizzes for free by uploading documents