Table 5.8 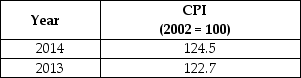
-Refer to Table 5.8.Suppose that the data in the table above reflect price levels in the economy.What is the inflation rate between 2013 and 2014?
A) 1.5%
B) 1.8%
C) 22.7%
D) 24.5%
E) 101%
Correct Answer:
Verified
Q179: Table 5.4 Q180: The iPhone 7 was launched without a Q181: The most widely used measure of inflation Q182: Shelter is the largest component of the Q182: Why does the substitution bias cause the Q185: Which of the following is the smallest Q186: If the CPI changes from 125 to Q187: Most economists believe that biases cause changes Q189: Cashmere socks cost 35 cents a pair Q191: Which of the following describes the accuracy![]()
Unlock this Answer For Free Now!
View this answer and more for free by performing one of the following actions

Scan the QR code to install the App and get 2 free unlocks

Unlock quizzes for free by uploading documents