Figure 5.1 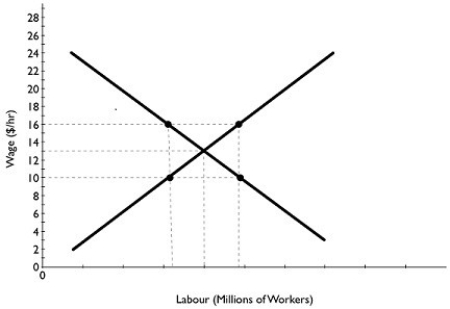 Alt text for Figure 5.1: In figure 5.1, a graph of the labour market.
Long description for Figure 5.1: The x-axis is labelled, labour (millions of workers) .The y-axis is labelled, wage (dollars per hour) , ranging from 0 to 28 in increments of 2.2 intersecting lines are shown.A line slopes down from the top left of the quadrant, near the value 24 on the y-axis, to the bottom right corner, near the end of the x-axis.A second line slopes up from the bottom left corner of the quadrant, near the origin, to the top right corner.4 points plotted along the 2 sloping lines, and the point of intersection of the 2 lines, are connected to the corresponding values on the x-axis, and to the values 10, 13 and 16 on the y-axis.
-Refer to Figure 5.1.Based on the graph of the labour market above, if a minimum wage is set at $10 per hour, which of the following will occur?
A) The unemployment rate will rise.
B) The unemployment rate will fall.
C) The level of unemployment will rise, but the percentage of the labour force unemployed will not change.
D) The quantity of labour supplied will rise.
E) None of the above will occur.
Correct Answer:
Verified
Q143: Why would a firm pay efficiency wages?
Q147: An efficiency wage
A)is higher than the market
Q148: What effect does the Employment Insurance program
Q149: Except during recessions, workers in Canada are
Q150: Which of the following is true about
Q151: Which of the following price indices comes
Unlock this Answer For Free Now!
View this answer and more for free by performing one of the following actions

Scan the QR code to install the App and get 2 free unlocks

Unlock quizzes for free by uploading documents