Figure 2.1 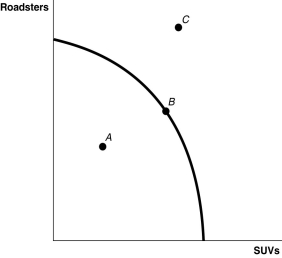 Alt text for Figure 2.1: In figure 2.1, a graph compares roadsters and S U Vs.
Long description for Figure 2.1: The x-axis is labelled, S U Vs, and the y-axis is labelled, roadsters.3 points A, B, and C are plotted on the graph.A concave curve is drawn between the y-axis and the x-axis, from near the top of the y-axis, to near the end of the y-axis.Near the mid-point of the curve, it passes through point B.Point A is between the curve and the origin, and point C is outside the curve, midway along the x-axis and near the top of the y-axis.
-Refer to Figure 2.1.At point A the opportunity cost of producing more SUVs is
A) 0 roadsters.
B) 0 SUVs.
C) 2.5 roadsters per SUV.
D) impossible to determine.
Correct Answer:
Verified
Q3: Toyota built an assembly plant in Woodstock,
Q5: The principle of opportunity cost is that
A)in

