Multiple Choice
Figure 17-3. On the graph, MS represents the money supply and MD represents money demand. The usual quantities are measured along the axes. 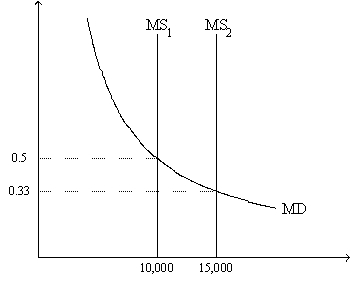
-Refer to Figure 17-3. At the end of 2009 the relevant money-supply curve was the one labeled MS1. At the end of 2010 the relevant money-supply curve was the one labeled MS2. Assuming the economy is always in equilibrium, what was the economy's approximate inflation rate for 2010?
A) -33 percent
B) 17 percent
C) 50 percent
D) 67 percent
Correct Answer:
Verified
Related Questions
Q81: Economic variables whose values are measured in
Q92: Figure 17-3. On the graph, MS represents

