Figure 17-1 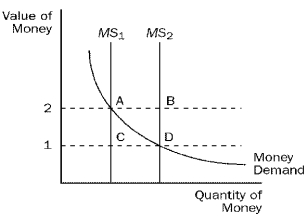
-Refer to Figure 17-1. When the money supply curve shifts from MS1 to MS2,
A) the demand for goods and services decreases.
B) the economy's ability to produce goods and services increases.
C) the equilibrium price level decreases.
D) None of the above is correct.
Correct Answer:
Verified
Q82: Economic variables whose values are measured in
Q84: Figure 17-2. On the graph, MS represents
Q85: Figure 17-3. On the graph, MS represents
Q86: Figure 17-1 Q87: Figure 17-2. On the graph, MS represents Q88: Figure 17-2. On the graph, MS represents Q91: Figure 17-2. On the graph, MS represents Q92: Figure 17-3. On the graph, MS represents Q93: Figure 17-1 Q94: Figure 17-1 Unlock this Answer For Free Now! View this answer and more for free by performing one of the following actions Scan the QR code to install the App and get 2 free unlocks Unlock quizzes for free by uploading documents![]()
![]()
![]()

