The figure given below represents the equilibrium price and output in the market for restaurant meals and delivery meals. Figure 4.1 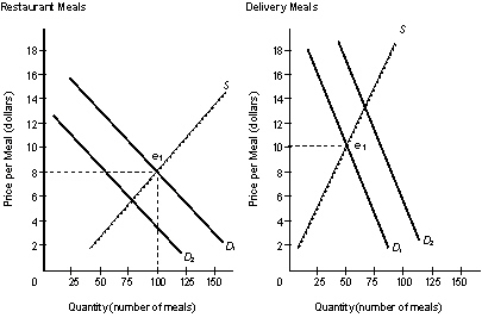
- Refer to Figure 4.1.Which of the following is represented by this figure?
A) Delivery meals and restaurant meals are complementary goods.
B) When producers of delivery and restaurant meals change their preferences,the consumers respond.
C) The increase in demand for delivery meals could have been caused by a change in consumers' tastes.
D) The fall in demand for restaurant meals was caused by an increase in the price for restaurant meals.
E) The demand for delivery meals is less elastic than that for restaurant meals.
Correct Answer:
Verified
Q9: In a market system,who ultimately determines what
Q10: The figure given below represents the equilibrium
Q11: The term consumer sovereignty refers to:
A)the fact
Q12: The figure given below represents the equilibrium
Q13: Firms try to minimize costs and maximize
Q15: Which of the following is true of
Q16: Mark's ability to purchase goods and services
Q17: The figure given below represents the equilibrium
Q18: The process of new products and new
Q19: The figure given below represents the equilibrium
Unlock this Answer For Free Now!
View this answer and more for free by performing one of the following actions

Scan the QR code to install the App and get 2 free unlocks

Unlock quizzes for free by uploading documents