The below indifference map shows the various combinations of hours of music and apples that yield different levels of utility. Figure 6.1 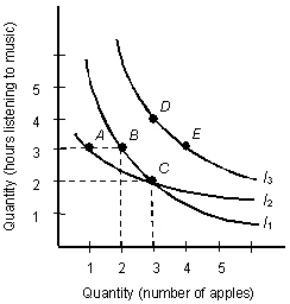
- Which of the following explains why indifference curve I2 should not cross indifference curve I1 as shown in Figure 6.1?
A) The consumer is not indifferent between A and B.
B) The consumer is not indifferent between A and C.
C) The consumer is not indifferent between B and C.
D) The consumer is not indifferent between D and E.
E) There is no reason why indifference curve I2 should not cross indifference curve I1 as shown.
Correct Answer:
Verified
Q82: The table below shows the total utility
Q86: The below indifference map shows the various
Q90: In labor markets,a change in the wage
Q91: The table below shows the total utility
Q92: An indifference curve shows _.
A)the relationship between
Q93: The table below shows the total utility
Q96: The below indifference map shows the various
Q96: The table below shows the total utility
Q97: The table below shows the total utility
Q99: The below indifference map shows the various
Unlock this Answer For Free Now!
View this answer and more for free by performing one of the following actions

Scan the QR code to install the App and get 2 free unlocks

Unlock quizzes for free by uploading documents