The figure given below shows the cost and revenue curves of a monopolist. Figure 10.9 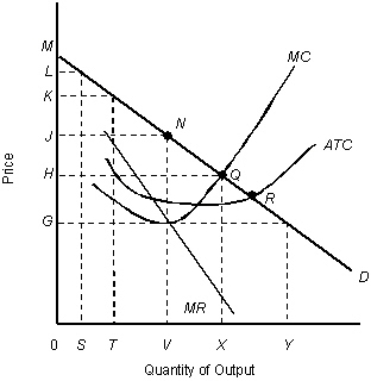
D: Average revenue
MR: Marginal revenue
ATC: Average total cost
MC: Marginal cost
-In Figure 10.9,what is the consumer surplus at the profit-maximizing levels of output and price?
A) JNM
B) 0JNV
C) HMQ
D) 0HQX
E) JHQN
Correct Answer:
Verified
Q81: The figure given below shows the cost
Q83: The figure given below shows the cost
Q88: The figure given below shows the cost
Q92: The following figure shows revenue and cost
Q93: The following figure shows revenue and cost
Q94: The figure given below shows the cost
Q97: The marginal revenue curve of a monopolist
Q98: Why does a efficiency loss arise under
Q99: The figure given below shows the cost
Q100: The figure given below shows the cost
Unlock this Answer For Free Now!
View this answer and more for free by performing one of the following actions

Scan the QR code to install the App and get 2 free unlocks

Unlock quizzes for free by uploading documents