The following figures show the demand and cost curves of a perfectly competitive and a monopoly firm respectively. Figure 10.7 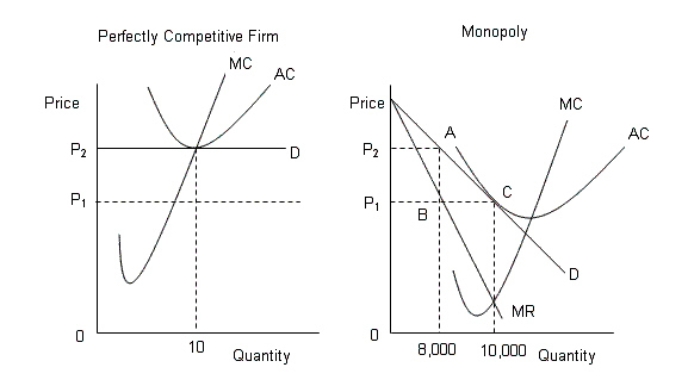
D: Average Revenue
AC: Average cost
MC: Marginal cost
MR: Marginal cost
-Refer to Figure 10.7.If the perfectly competitive industry and the monopoly produces the same quantity,then:
A) there are 10 firms in the perfectly competitive industry.
B) there are 800 firms in the perfectly competitive industry.
C) there are 1,000 firms in the perfectly competitive industry.
D) there are 2,000 firms in the perfectly competitive industry.
E) there are 100 firms in the perfectly competitive industry.
Correct Answer:
Verified
Q48: The table given below shows the price,
Q57: The table given below shows the price,marginal
Q58: The following table shows the marginal revenues
Q59: A monopolist can charge a high price
Q61: The figure given below shows the demand
Q63: The figure below shows the market equilibrium
Q64: Movie theaters are able to offer discounts
Q65: Perfect price discrimination occurs when:
A)each customer is
Q67: The following figures show the demand and
Q74: The figure given below shows the demand
Unlock this Answer For Free Now!
View this answer and more for free by performing one of the following actions

Scan the QR code to install the App and get 2 free unlocks

Unlock quizzes for free by uploading documents