The figures given below represent the revenue curves of a monopolist. Figure 10.2 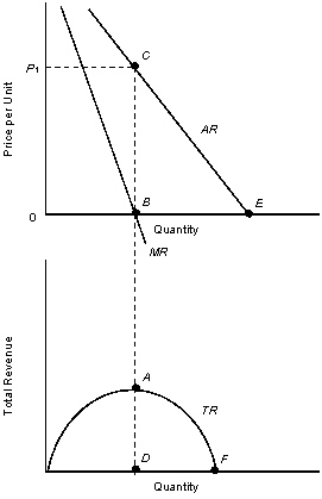
TR: Total revenue curve
AR: Average revenue curve
MR: Marginal revenue curve
-Refer to Figure 10.2.If the output at E is 600 units,then the output at B is _____ units.(We know that the slope of the marginal revenue curve is twice the slope of the average revenue curve.)
A) 900 units.
B) 200 units.
C) 300 units.
D) 1200 units.
E) 800 units.
Correct Answer:
Verified
Q24: The table given below shows the prices
Q25: The figures given below represent the revenue
Q27: The table given below shows the prices
Q28: The figures given below represent the revenue
Q29: The table given below shows the prices
Q30: The figures given below represent the revenue
Q31: The figure given below shows the demand
Q33: The table given below shows the prices
Q34: If a monopolist is producing at a
Q38: The figures given below represent the revenue
Unlock this Answer For Free Now!
View this answer and more for free by performing one of the following actions

Scan the QR code to install the App and get 2 free unlocks

Unlock quizzes for free by uploading documents