The figure given below depicts the demand and supply of Brazilian reals in the foreign exchange market.Assume that the market operates under a flexible exchange rate regime. Figure 22.1 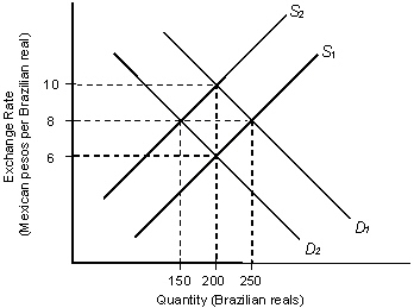 In the figure:
D1 and D2: Demand for Brazilian reals
S1 and S2: Supply of Brazilian reals
-Refer to Figure 22.1.The supply curves shown for Brazilian reals are based on:
A) the supply of Brazilian goods in the international market.
B) the Brazilian demand for Mexican products.
C) the supply of Mexican pesos in the market.
D) the Brazilian demand for Brazilian products.
E) the Mexican demand for Brazilian products.
Correct Answer:
Verified
Q48: The figure given below depicts the foreign
Q51: The figure given below depicts the foreign
Q53: The figure given below depicts the foreign
Q56: The figure given below depicts the foreign
Q59: The figure given below depicts the foreign
Q59: Under the flexible exchange rate system,when a
Q60: The figure given below depicts the foreign
Q64: The figure given below depicts the foreign
Q70: The figure given below depicts the foreign
Q72: The figure given below depicts the foreign
Unlock this Answer For Free Now!
View this answer and more for free by performing one of the following actions

Scan the QR code to install the App and get 2 free unlocks

Unlock quizzes for free by uploading documents