Short Answer
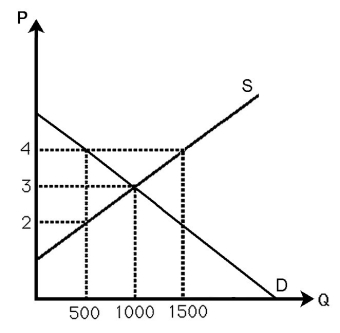
-The above figure shows the demand and supply curves in the market for milk.If the government imposes a quota at 500 gallons,calculate the deadweight loss.
Correct Answer:
Verified
DWL = .5(4...
View Answer
Unlock this answer now
Get Access to more Verified Answers free of charge
Related Questions

