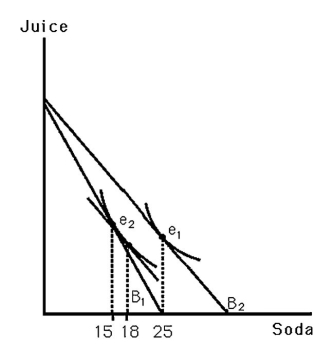
-The above figure shows Bobby's indifference map for soda and juice.B1 indicates his original budget line.B2 indicates his budget line resulting from an increase in the price of soda.From the graph,one can conclude that
A) Bobby views soda as an inferior good.
B) Bobby's demand for soda is perfectly inelastic.
C) Bobby views soda as a normal good.
D) the income elasticity of demand for soda is 1.
Correct Answer:
Verified
Q39: Q40: A movement upward along an upward sloping Q41: When the price of a good changes,the Q42: Suppose Lisa spends all of her money Q43: The substitution effect can be measured holding Q45: Q46: In the case of a normal good, Q47: When measuring the substitution effect,one uses the Q48: When income increases by 1%,the quantity demanded Q49: Unlock this Answer For Free Now! View this answer and more for free by performing one of the following actions Scan the QR code to install the App and get 2 free unlocks Unlock quizzes for free by uploading documents![]()
![]()
A)![]()

