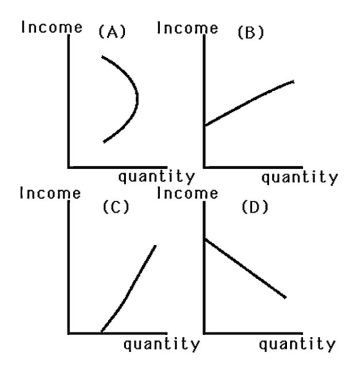
-Which graph in the above figure best represents a good that is an inferior good at some income levels,and a normal good at other income levels?
A) Graph A
B) Graph B
C) Graph C
D) Graph D
Correct Answer:
Verified
Q18: Q19: A demand curve for a Giffen good Q20: As the price of a Giffen good Q21: An individual derives utility from consuming "all Q22: Q24: Suppose the quantity of x is measured Q25: An inferior good exhibits Q26: After Joyce and Larry purchased their first Q27: When deriving an Engel curve,the prices of Q28: Unlock this Answer For Free Now! View this answer and more for free by performing one of the following actions Scan the QR code to install the App and get 2 free unlocks Unlock quizzes for free by uploading documents![]()
![]()
A) a negative income![]()

