Which one of the following graphs shows the rate at which heat is emitted from a hot body as a function of its Kelvin temperature T? 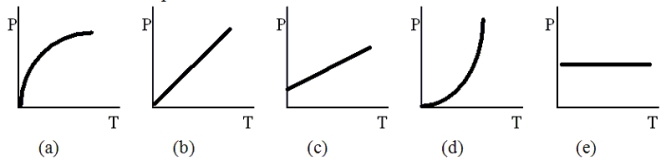
A) (A)
B) (B)
C) (C)
D) (D)
E) (E)
Correct Answer:
Verified
Q25: Which one of the following objects,all initially
Q26: Assume that the sun is a sphere
Q27: If a beaker of water is placed
Q28: Two bars,A and B,each of length 2.0
Q29: Complete the following statement: Most of the
Q31: Assuming a filament in a 100 W
Q32: A beaker of water is placed on
Q33: Two bars,A and B,each of length 2.0
Q34: The sun continuously radiates energy into space
Q35: Two identical solid spheres have the same
Unlock this Answer For Free Now!
View this answer and more for free by performing one of the following actions

Scan the QR code to install the App and get 2 free unlocks

Unlock quizzes for free by uploading documents