What type of graph is displayed below?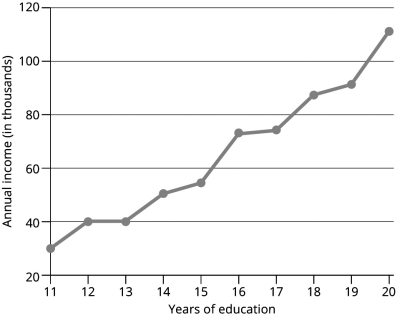
A) bar graph
B) histogram
C) line graph
D) pie chart
Correct Answer:
Verified
Q29: The Houston Area Survey is conducted annually
Q30: You have collected sample data on the
Q31: Nadia has collected data on whether students
Q32: A local high school wants to compare
Q33: The _ is the value of the
Q35: _ show the 95% confidence intervals for
Q36: Population trends are bivariate patterns in which
Q37: If you want to compare groups in
Q38: The cross-tabulation is using _ percentages.
A)cell
B)column
C)marginal
D)row
Q39: Dr.Raza wants to present data on how
Unlock this Answer For Free Now!
View this answer and more for free by performing one of the following actions

Scan the QR code to install the App and get 2 free unlocks

Unlock quizzes for free by uploading documents