The following figure shows the net primary productivity (NPP)in marine biomes around the world.
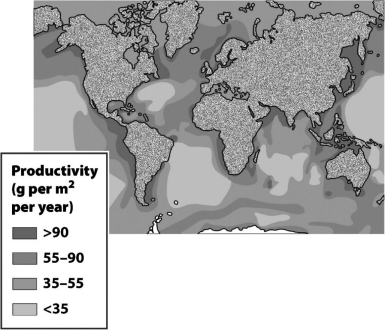 One factor that influences the areas with >90 g/m² per year in the above diagram involving nutrient-rich layers being driven to the surface is ________.
Correct Answer:
Verified
Q43: _,caused by algal blooms triggered by excess
Q44: Humans have harmed hemlock populations by
A) mining
Q45: Eventually,all biomass produced by any organism is
Q46: Some biologically important substances are transferred between
Q47: Nutrients that have a(n)_ cycle move relatively
Q49: Biologists use the term _ to refer
Q50: A community of organisms,together with the chemical
Q51: Ecosystems are closed systems.
Q52: Each level of an energy pyramid corresponds
Q53: Rainfall with a low pH is called
Unlock this Answer For Free Now!
View this answer and more for free by performing one of the following actions

Scan the QR code to install the App and get 2 free unlocks

Unlock quizzes for free by uploading documents