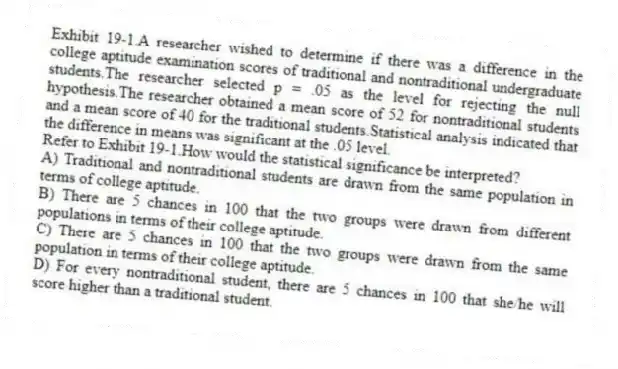
Exhibit 19-1.A researcher wished to determine if there was a difference in the college aptitude examination scores of traditional and nontraditional undergraduate students.The researcher selected p = .05 as the level for rejecting the null hypothesis.The researcher obtained a mean score of 52 for nontraditional students and a mean score of 40 for the traditional students.Statistical analysis indicated that the difference in means was significant at the .05 level.
-Refer to Exhibit 19-1.How would the statistical significance be interpreted?
A) Traditional and nontraditional students are drawn from the same population in terms of college aptitude.
B) There are 5 chances in 100 that the two groups were drawn from different populations in terms of their college aptitude.
C) There are 5 chances in 100 that the two groups were drawn from the same population in terms of their college aptitude.
D) For every nontraditional student, there are 5 chances in 100 that she/he will score higher than a traditional student.
Correct Answer:
Verified
Q64: The following statement would likely be included
Q65: Exhibit 19-1.A researcher wished to determine if
Q66: The following statement would likely be included
Q67: Which of the following questions is primarily
Q68: Which of the following is primarily a
Q70: A retained null hypothesis means that
A) there
Q71: The following statement would likely be included
Q72: Indicate which of the following is true
Q73: The results of an experimental study were
Q74: Exhibit 19-1.A researcher wished to determine if
Unlock this Answer For Free Now!
View this answer and more for free by performing one of the following actions

Scan the QR code to install the App and get 2 free unlocks

Unlock quizzes for free by uploading documents