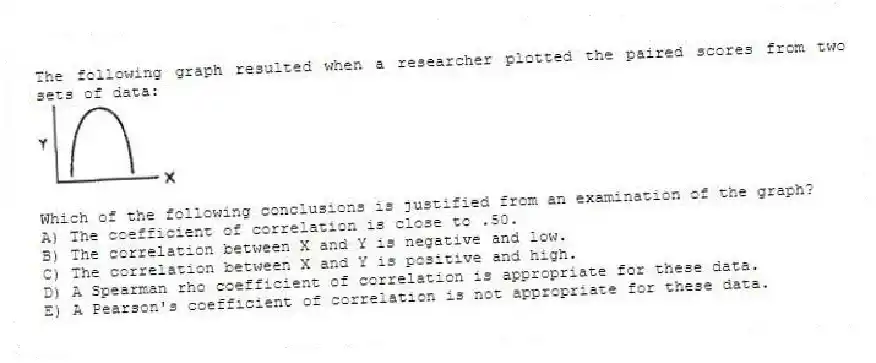
The following graph resulted when a researcher plotted the paired scores from two sets of data: 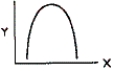
Which of the following conclusions is justified from an examination of the graph?
A) The coefficient of correlation is close to .50.
B) The correlation between X and Y is negative and low.
C) The correlation between X and Y is positive and high.
D) A Spearman rho coefficient of correlation is appropriate for these data.
E) A Pearson's coefficient of correlation is not appropriate for these data.
Correct Answer:
Verified
Q37: The standard error of estimate is equal
Q38: Other things being equal, as the sample
Q39: When testing the statistical significance of
Q40: The process of applying a prediction equation
Q41: If a relationship between two variables is
Q43: Research shows that aptitude scores are better
Q44: The most useful correlational technique to use
Q45: Research has shown that high school students'
Q46: Exhibit 13-5.Choose the type of correlational statistic
Q47: Before calculating a correlation coefficient, a researcher
Unlock this Answer For Free Now!
View this answer and more for free by performing one of the following actions

Scan the QR code to install the App and get 2 free unlocks

Unlock quizzes for free by uploading documents