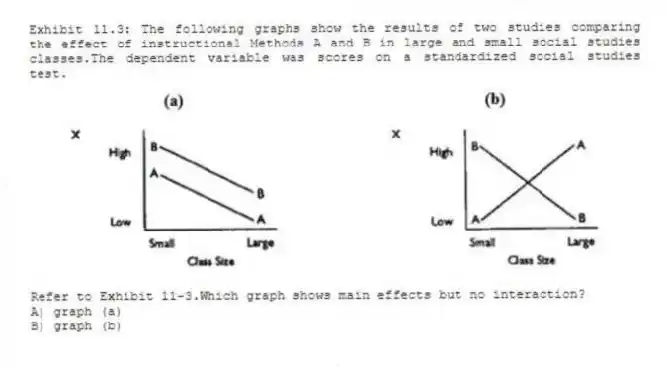
Exhibit 11.3: The following graphs show the results of two studies comparing the effect of instructional Methods A and B in large and small social studies classes.The dependent variable was scores on a standardized social studies test.
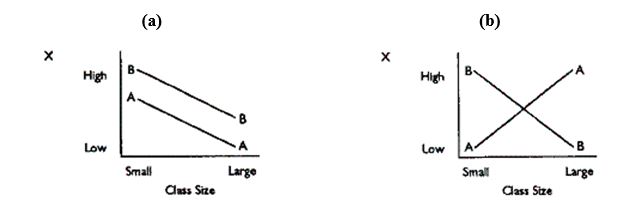
-Refer to Exhibit 11-3.Which graph shows main effects but no interaction?
A) graph (a)
B) graph (b)
Correct Answer:
Verified
Q44: The best experimental design to use to
Q45: Exhibit 11.3: The following graphs show the
Q46: Under which of the following circumstances would
Q47: Exhibit 11-4.Identify the major threat to internal
Q48: In contrast to time series designs, multiple
Q50: The main internal validity problem of the
Q51: In an experimental study using pre- and
Q52: The difference between the group means in
Q53: A randomized matched subjects, control group design
Q54: The major means of control in single-subject
Unlock this Answer For Free Now!
View this answer and more for free by performing one of the following actions

Scan the QR code to install the App and get 2 free unlocks

Unlock quizzes for free by uploading documents