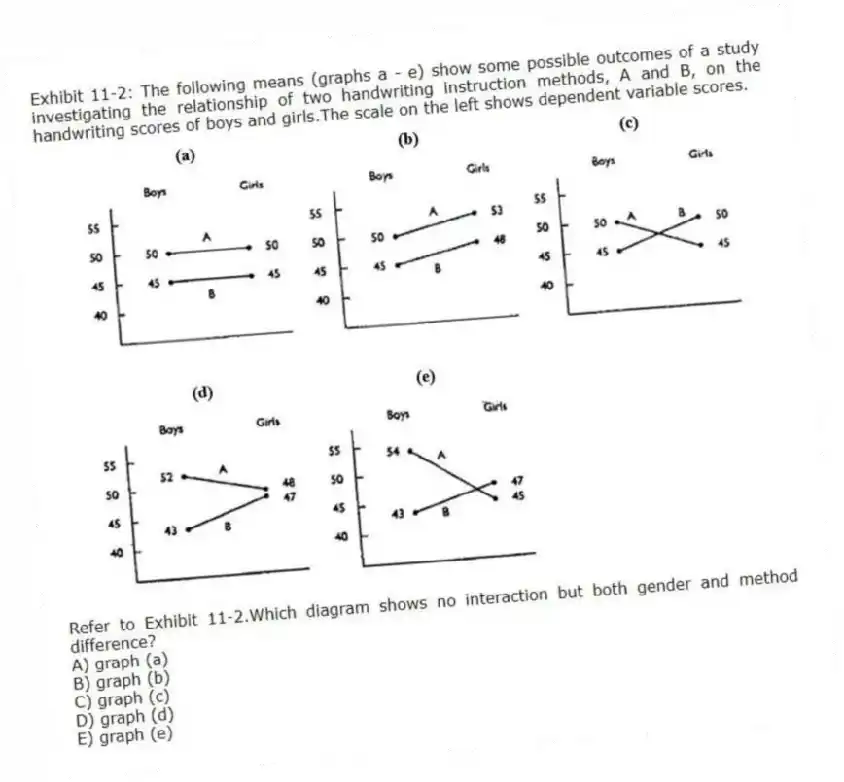
Exhibit 11-2: The following means (graphs a - e) show some possible outcomes of a study investigating the relationship of two handwriting instruction methods, A and B, on the handwriting scores of boys and girls.The scale on the left shows dependent variable scores.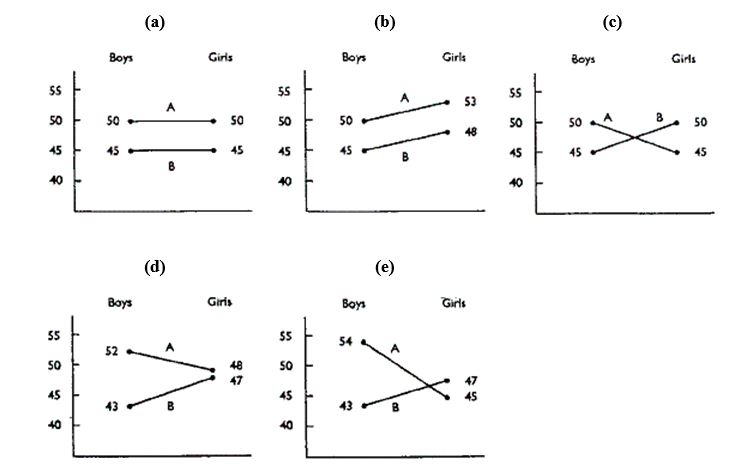
-Refer to Exhibit 11-2.Which diagram shows no interaction but both gender and method difference?
A) graph (a)
B) graph (b)
C) graph (c)
D) graph (d)
E) graph (e)
Correct Answer:
Verified
Q29: In a nonrandomized control group, pretest-posttest design,
Q30: Single-case designs have been particularly useful in
A)
Q31: A simple reversal (ABA) design
A) concludes with
Q32: Counterbalanced experimental designs are especially susceptible to
Q33: A researcher wants to study the effect
Q35: What are the two essential features of
Q36: The control group time series design overcomes
Q37: Exhibit 11-2: The following means (graphs a
Q38: A research study has a design
Q39: The first step in the ABAB design
Unlock this Answer For Free Now!
View this answer and more for free by performing one of the following actions

Scan the QR code to install the App and get 2 free unlocks

Unlock quizzes for free by uploading documents