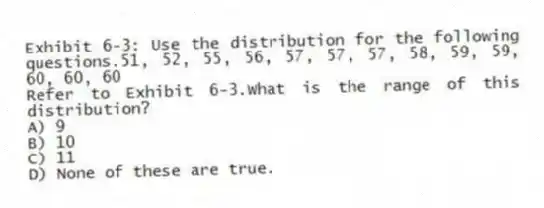
Exhibit 6-3: Use the distribution for the following questions.51, 52, 55, 56, 57, 57, 57, 58, 59, 59, 60, 60, 60
-Refer to Exhibit 6-3.What is the range of this distribution?
A) 9
B) 10
C) 11
D) None of these are true.
Correct Answer:
Verified
Q12: The measure of central tendency that indicates
Q13: A T-score of 40 is higher than
Q14: If your test score was one standard
Q15: A student with a z-score of 2.5
A)
Q16: Which measure of central tendency is best
Q18: A 100-point math test has a mean
Q19: Exhibit 6-2: Use the distribution for the
Q20: Exhibit 6-2: Use the distribution for the
Q21: Exhibit 6-4: Use the data for the
Q22: The coefficient of determination of an r
Unlock this Answer For Free Now!
View this answer and more for free by performing one of the following actions

Scan the QR code to install the App and get 2 free unlocks

Unlock quizzes for free by uploading documents