The figure given below represents the output choices of each of the two oligopolists, given the choices of its competitor.QA and QB are the quantities of output produced by Producer A and Producer B.The marginal cost of production is zero for both producers.
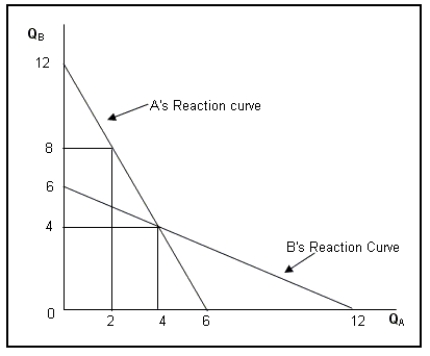
-Refer to Figure .Suppose the government imposes a tax of $1.5 on each unit of A's output.Which of the following changes in the total output will be observed under Cournot equilibrium?
A) Total output will decrease although the market share of the producers will remain same.
B) Producer B's output will increase leading to a rise in total output.
C) Producer A's output will decline leading to a fall in total output.
D) The market share of the Producer A will fall, while that of B will increase.
Correct Answer:
Verified
Q50: In the Stackelberg leadership model,
A)the leader earns
Q51: Which of the following games will have
Q52: In a mixed strategy situation, like the
Q53: How does the existence of the fringe
Q54: Why did the attempts by some airlines
Q56: The figure given below represents the output
Q57: The following matrix represents the payoffs to
Q58: In games without dominant strategies the Nash
Q59: How does a dominant firm try to
Q60: How is the dominant firm's residual demand
Unlock this Answer For Free Now!
View this answer and more for free by performing one of the following actions

Scan the QR code to install the App and get 2 free unlocks

Unlock quizzes for free by uploading documents