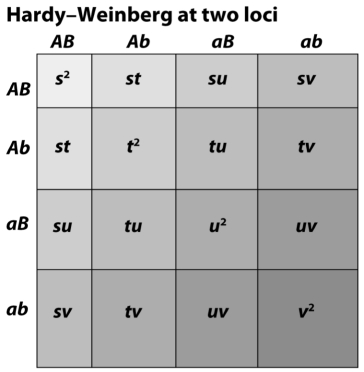
 The figure above demonstrates that Hardy-Weinberg frequencies are
A) uniquely determined by allele frequencies.
B) determined by haplotype frequencies.
C) depend on the recombination rate.
D) All of the above
E) None of the above
Correct Answer:
Verified
Q12: Consider a population with two loci (A,B),each
Q13: Q14: Q15: What is the largest possible value that Q16: The rediscovery of Mendelian inheritance caused increased Q18: Which of the following can generate linkage Q19: Assuming the value of linkage disequilibrium (D)is Q20: Consider two loci on a single chromosome.These Q21: In a population of dragonflies,wing structure is Q44: Why would we expect genotypic adaptive landscapes![]()
![]()
Unlock this Answer For Free Now!
View this answer and more for free by performing one of the following actions

Scan the QR code to install the App and get 2 free unlocks

Unlock quizzes for free by uploading documents