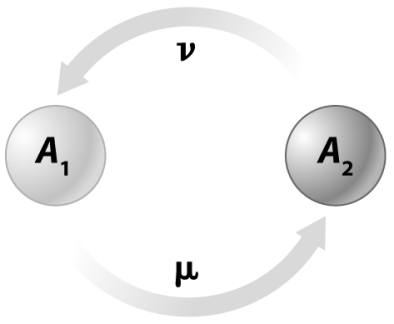
In the following figure,m is the mutation rate from allele A₁,which produces a functional protein,to A₂,an allele that fails to produce a functional protein.The reverse mutation rate,n,describes the mutation rate from A₂,the nonfunctioning allele,to A₁,the functional protein allele.Why would one expect the value of m to be much higher than the value of n at this locus?
Correct Answer:
Verified
View Answer
Unlock this answer now
Get Access to more Verified Answers free of charge
Q18: Which of the bar graphs in the
Q19: Assume a biallelic locus in a diploid
Q20: When a population is in a neutral
Q21: Lifetime fitness,as demonstrated by Cummings et al.'s
Q22: Consider a sample of 100 individuals sampled
Q24: Mating preferences drive assortative mating
A)all of the
Q25: Consider a locus in which the fitness
Q26: What is the frequency of homozygous individuals
Q27: Disassortative mating may be beneficial because
A)it will
Q28: In pocket mice,possession of the D allele
Unlock this Answer For Free Now!
View this answer and more for free by performing one of the following actions

Scan the QR code to install the App and get 2 free unlocks

Unlock quizzes for free by uploading documents