Short Answer
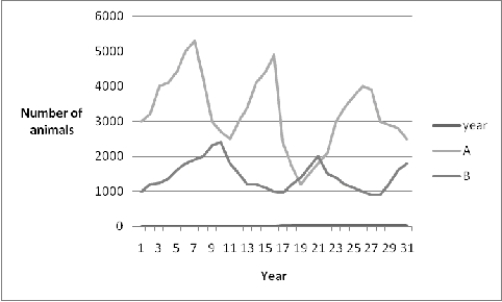 The graph above shows the census count for two animal species, A and B, over a 31 year period. Animal A and animal B have a predator-prey relationship.
-For the graph shown above of animal species A and animal species B, which animal is the predator and which animal is the prey species?
Correct Answer:
Verified
Animal A is the prey...
View Answer
Unlock this answer now
Get Access to more Verified Answers free of charge
Related Questions

