Multiple Choice
Figure 10-15
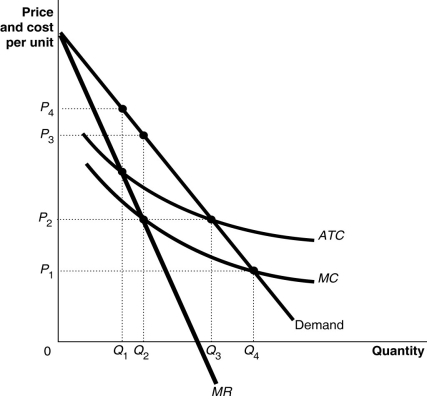 Figure 10-15 shows the cost and demand curves for the Erickson Power Company.
-Refer to Figure 10-15.The profit-maximizing price is
A) P₁.
B) P₂.
C) P₃.
D) P₄.
Correct Answer:
Verified
Related Questions
Q202: Consider an industry that is made up
Q207: The Sherman Act prohibited
A)marginal cost pricing.
B)setting price
Q209: How do the price and quantity of
Q221: Article Summary
In late 2017, informed sources announced
Q225: Economic efficiency requires that a natural monopoly's
Q226: The first important law regulating monopolies in
Unlock this Answer For Free Now!
View this answer and more for free by performing one of the following actions

Scan the QR code to install the App and get 2 free unlocks

Unlock quizzes for free by uploading documents