Exhibit 14-4 Aggregate supply and demand curves
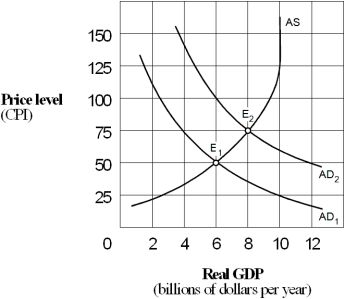
-The increase in the price level as the economy moves from E₁ to E₂ in Exhibit 14-4 represents:
A) cost-push inflation.
B) demand-shock inflation.
C) wage push inflation.
D) demand-pull inflation.
Correct Answer:
Verified
Q136: Demand-pull inflation is associated with a(n):
A) decrease
Q137: Cost-push inflation occurs when the:
A) aggregate demand
Q138: When OPEC caused the price of oil
Q139: Exhibit 14-3 Aggregate supply and demand curves
Q140: _ inflation can be explained by an
Q142: Exhibit 14-7 Aggregate supply and demand curves
Q143: The aggregate demand curve is downward sloping.
Q144: Exhibit 14-6 Aggregate supply curve

Q145: The aggregate demand curve slopes downward because
Q146: Exhibit 14-8 Aggregate demand and supply
Unlock this Answer For Free Now!
View this answer and more for free by performing one of the following actions

Scan the QR code to install the App and get 2 free unlocks

Unlock quizzes for free by uploading documents