Exhibit 6-2 Cost schedule for pizza production
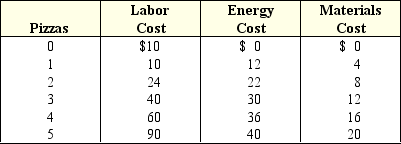
-Exhibit 6-2 shows the labor,energy,and materials cost of making various quantities of pizzas.The table shows that the energy cost of making pizzas will:
A) increase at a decreasing rate.
B) decrease at a decreasing rate.
C) decrease at an increasing rate.
D) increase at an increasing rate.
E) increase at a constant rate.
Correct Answer:
Verified
Q21: Which of the following best describes a
Q28: Bill lives in Montana and likes to
Q55: A firm can produce 450 gallons of
Q61: Exhibit 6-2 Cost schedule for pizza production
Q63: Suppose when a car wash has 2
Q65: Marginal product measures the change in:
A) total
Q67: Exhibit 6-1 Production of pizza data
Q82: As a fishing firm hires its first,
Q123: In order for the law of diminishing
Q174: The long run is a period of
A)
Unlock this Answer For Free Now!
View this answer and more for free by performing one of the following actions

Scan the QR code to install the App and get 2 free unlocks

Unlock quizzes for free by uploading documents