Exhibit 5-9 Supply and demand curves for good X
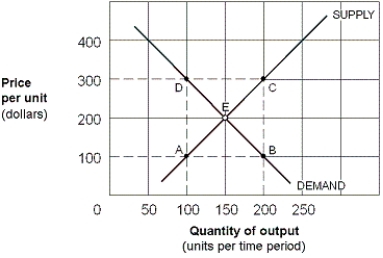
-As shown in Exhibit 5-9, the price elasticity of demand for good X between points E and B is:
A) 3/7 = 0.43.
B) 7/3 = 2.33.
C) 1/2 = 0.50.
D) 1.
Correct Answer:
Verified
Q125: Assume 300 billion pounds of Ostrich meat
Q128: The more elastic the supply of a
Q132: The more inelastic the demand for a
Q149: If the government wants to raise tax
Q199: If the government wants to raise tax
Q229: Exhibit 5-9 Supply and demand curves for
Q231: Exhibit 5-8 Supply and demand curves for
Q232: Exhibit 5-9 Supply and demand curves for
Q235: A law requiring sellers to pay the
Q237: Exhibit 5-9 Supply and demand curves for
Unlock this Answer For Free Now!
View this answer and more for free by performing one of the following actions

Scan the QR code to install the App and get 2 free unlocks

Unlock quizzes for free by uploading documents